Back to Blog
    GO Report

    Why the GO Report Starts With These Six Categories

    A benchmark is only as honest as the number of real transactions behind it. Here's why the GO Report launches in six categories — and what "enough data" actually buys you.

    July 28, 2026
    Why the GO Report Starts With These Six Categories
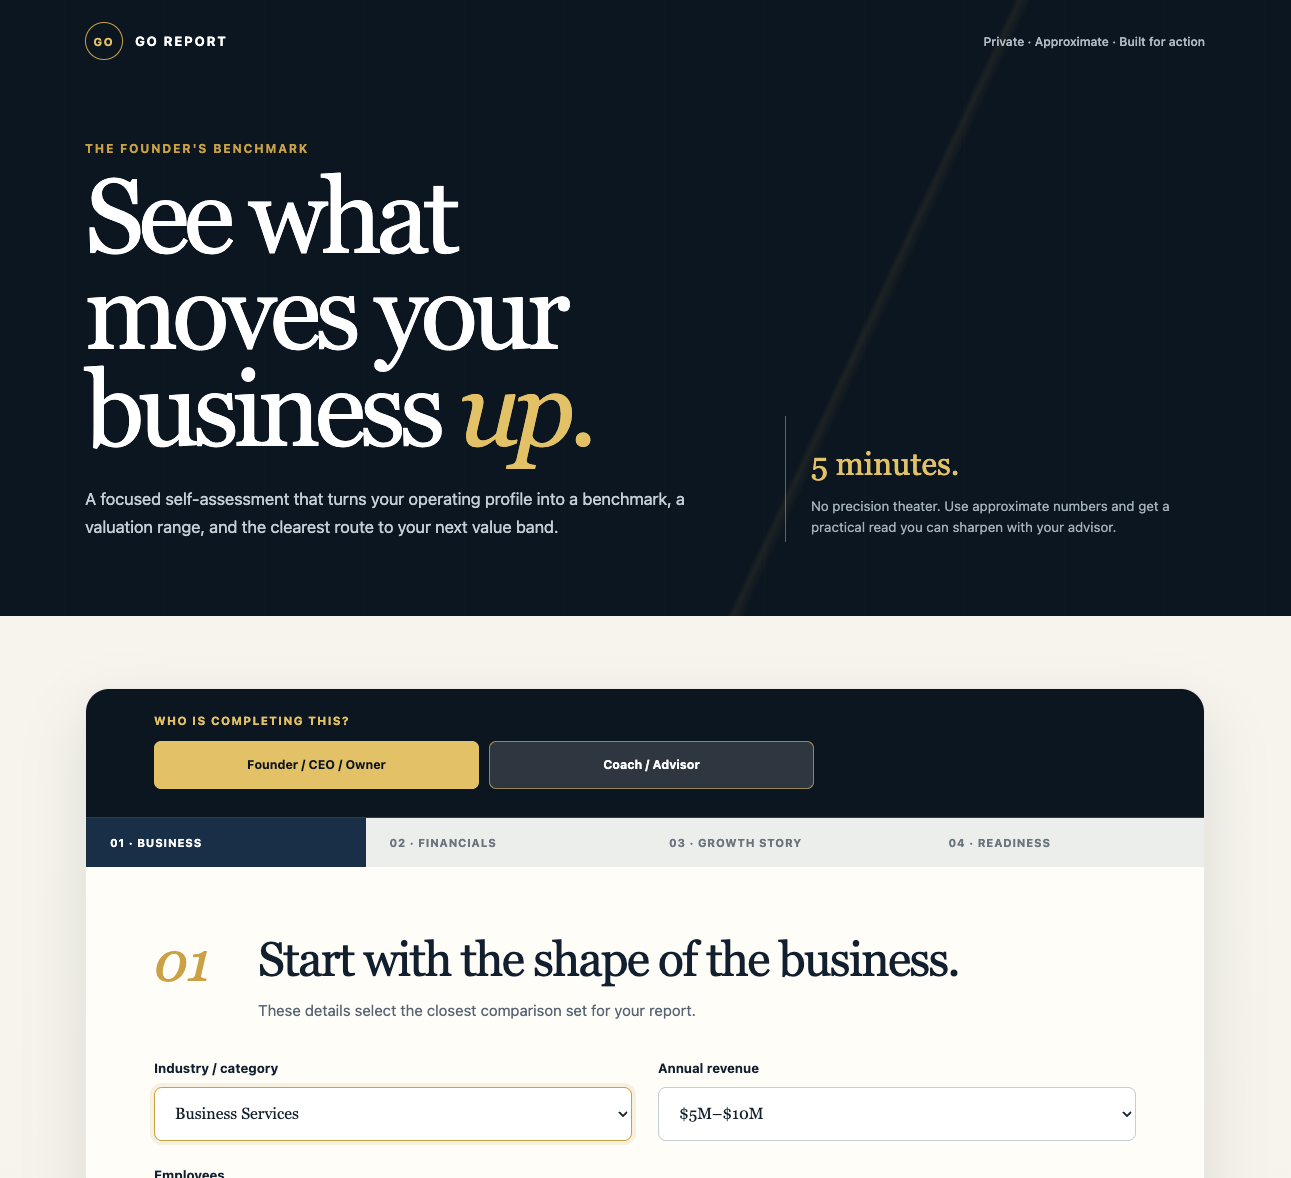
    A benchmark is only as honest as the number of real transactions behind it. That one sentence decided where we started. When we built the GO Report, we could have let a founder type in any industry and handed back a number. Plenty of tools do. But a valuation range built on three comparable sales isn''t a benchmark — it''s a guess wearing a suit. We would rather tell you "we don''t have enough data to be honest about your category" than give you false precision you might carry into a boardroom or a buyer conversation. So we started where the data is deep enough to tell you something true. Six categories, chosen for one reason: transaction density. The six — and the deals behind them These are the categories where the lower middle market actually trades in volume, where private equity and strategic buyers are most active, and where there''s enough recent, comparable deal flow to draw real value bands — not just a single average. Category Transactions in our panel (trailing ~24 mo) Why the data runs deep Business Services ~2,000+ B2B is the single largest slice of lower-middle-market M&A — roughly 40% of all deals. Recurring, tech-enabled services are in especially high demand. Software / SaaS ~1,800+ Consistently a top-three category, with the deepest public and private comp coverage of any sector we track. Industrial Services ~1,500+ Manufacturing and industrial services make up around a fifth of all private-equity deal activity — broad, active, and well-documented. Healthcare Services ~1,300+ The most active roll-up sector in the market: over a thousand platform transactions plus hundreds of add-ons every year. Consumer Services ~1,000+ B2C rounds out the top three categories, with steady franchise and services deal flow. Distribution ~850+ A steady, well-tracked market with clearly defined valuation bands by company size. (Counts reflect our benchmark panel — drawn from private-transaction and sponsored-deal data — over the trailing ~24 months. They refresh quarterly. Figures are directional, not an appraisal.) What "enough data" actually buys you When a category has thousands of recent transactions behind it, we can do three things we simply can''t do in a thin market: Draw real value bands, not one average. Businesses don''t trade at a single multiple. They trade in bands that step up with size — and the jump from one band to the next is often worth more than the earnings growth that gets you there. Showing you that staircase, and how close you are to the next step, requires enough deals in each band to be credible. Tell you how sure we are. Every band in your report carries a transaction count. Where the data is deep, we say so. Where a particular band is thin, we flag it as directional rather than dressing it up. You should always know how much evidence sits behind the number. Benchmark you against your actual peers. A "software company" and a "distribution business" don''t just trade at different multiples — buyers read them completely differently. Deep, category-specific data means your benchmark reflects businesses like yours, not a blended market average that describes no one. What we don''t do If your business sits outside these six — a niche, an emerging category, a corner of the economy that trades rarely — the GO Report won''t invent a number for you. You''ll see a straight answer: there isn''t enough transactional data to automate a report for your sector. That''s not a dead end; a Trajectory analyst can build a benchmark by hand. But we won''t let software do it on data that isn''t there. Absence of evidence is itself a finding — and pretending otherwise is exactly the false precision we built this tool to avoid. Six is a starting line, not a ceiling We began with these six because they let us be honest on day one. But the picture keeps getting sharper. Every engagement we run adds real, current deal data to our panel — which means bands tighten, confidence grows, and new categories cross the threshold where an honest automated benchmark becomes possible. The list will grow. It will grow the moment the data says it can, and not a day before. That''s the whole idea behind the GO Report: give founders a benchmark they can actually trust — because we''d rather be useful in six categories than misleading in sixty. The GO Report is a free, five-minute self-assessment. Enter your operating profile, see where your business sits against real transactions in your category, and find out how close you are to your next value band. It''s directional planning information, not financial, tax, or legal advice.